

Getting started with Syntropy Stack is a quick and easy process. This guide will walk you through how to sign up, set up your network in Syntropy Stack, and begin monitoring key metrics like latency and bandwidth.
Check out the video tutorial
A simple four step guide:
- Sign up
- Connect
- Optimize
- Monitor
1. Sign up
Go to our login page to sign up for a Syntropy Stack account.

2. Connect
Once you've signed in to Syntropy Stack, you'll be presented with your main dashboard. To get started, click the "Add Endpoints" button at the center of the page and follow the steps below.

Add your first endpoint
To add an endpoint, you first need to install Syntropy Agent, our software dependency.
Here’s how to do it:
- Generate the Agent Token through Syntropy Stack’s UI and copy it.
- Go to the User section of the platform.
- Click on “New Agent Token” and create one by adding a name and its expiration date.
- Your agent token will only be displayed once, so make sure to save it. Also, note that you can use the same agent token multiple times.
- Navigate to Network -> Endpoints -> Add Endpoints and paste your Agent Token in the input box.

- Install WireGuard on your device.
- Finally, install Syntropy Agent. We have multiple installation options:
- Docker (MacOS + Linux)
- Ansible
- Windows
- Build from source
Once you’ve installed Syntropy Agent on your device, your new endpoint will appear on the Endpoints table and in the Graph section within Syntropy Stack.

This table displays key information about your endpoints, including name, type, IP, ID, provider, installed agent version, networks, and any assigned tags. The table also displays your endpoints’ statuses and the last time they were connected (in case they go offline for any reason).
Here’s some important information about the different statuses your endpoints could have:
- Green icon - No issues. Your endpoint is up and running.
- Grey icon - Your endpoint is offline.
- Orange icon - This could mean an issue due to a duplicated name or that tags aren’t allowed because of your chosen Agent token scopes. A tooltip will explain the specific problem.
- Red icon - This can either mean that there’s a Wireguard configuration issue or that there’s a duplicate endpoint name. A tooltip will explain the specific problem in this case as well.
You can check this Documentation page for more details on managing your endpoints.
Connect your endpoints
All of the endpoints in your account are visible in the overall Network view, a hub where you can see all of your endpoint’s connections at once. You can manage your entire network’s structure here by adding, removing, or changing those connections.
To add a connection between two endpoints, simply click on any individual endpoint and then pick a second endpoint from the list to connect it to.
You can also click on endpoints to modify their already-existing connections individually, adding and removing them as you wish.

For easier navigation, you can use the search feature or switch between the “Show All” and “Show Selected” options.
Enable services on your endpoints
The small numbers by your endpoint’s names on the Endpoints table indicate how many services they contain and how many of those services are enabled. The table also displays other important endpoint information, including type, network, address, and also TCP/UDP ports.
Currently, we support three types of services:
- Docker
- Kubernetes
- Host (Hardware)

The service configuration you choose for an endpoint in the table seen above is then passed on to that endpoint’s connections.
Inactive services that are not used in any of your endpoint connections are removed automatically after some inactivity period. However, if a service becomes inactive but is still currently used in any of your connections, you have the option to delete the service manually.
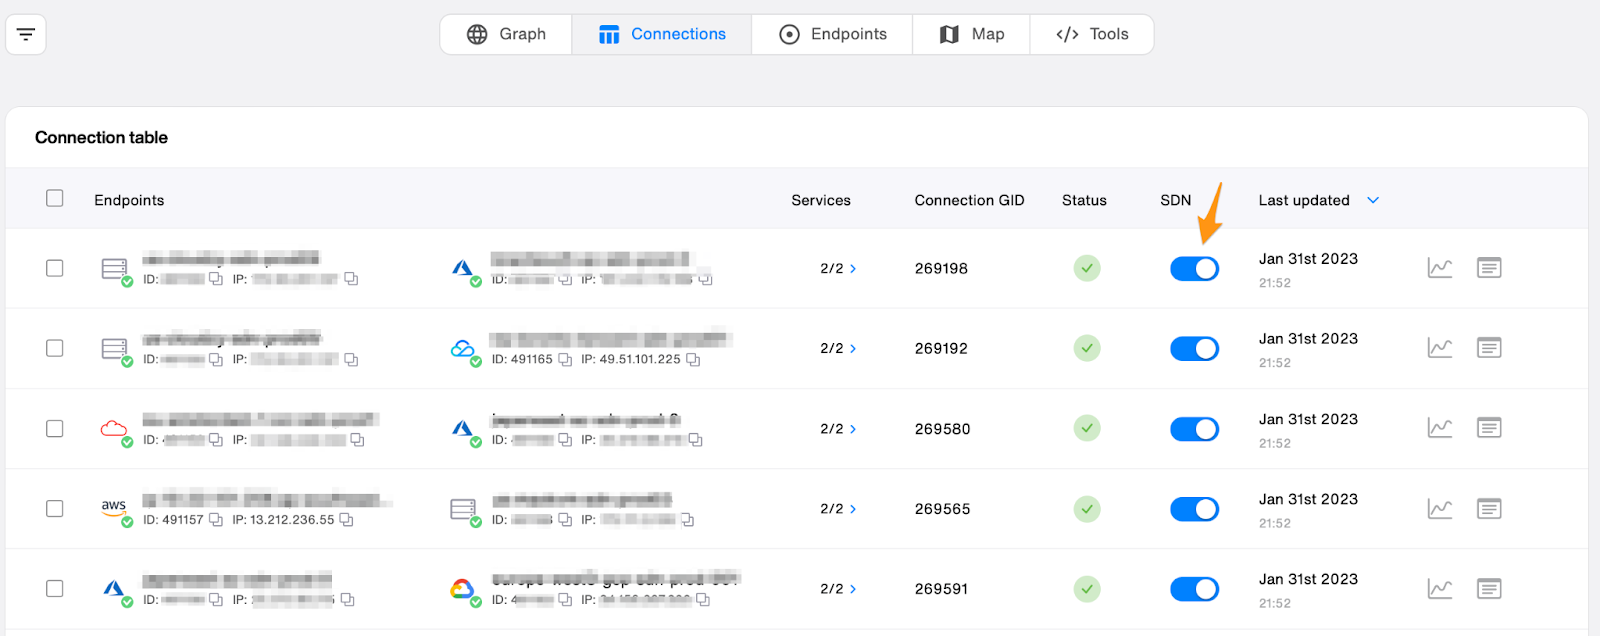
3. Optimize your connections
Syntropy Stack now makes it possible for you to optimize your connections through the Syntropy Relay Network. You can enable or disable them by opting in or out of our SDN network with a single click. You can do this either when you’re creating a new connection or by going through the Network Table, as shown in the image below.
An important note - when you sign up, you’re given 50 GB of free optimized bandwidth on Syntropy Stack that is used only when actively routing through the Syntropy Relay Network. If you run out of this bandwidth, your connections will default to using public Internet paths.
Buy more optimized bandwidth (optional)
You can purchase more bandwidth by going to the Workspace section, clicking “Top-up,” selecting the amount that you want to purchase, and moving through the checkout process.

To ensure full transparency on Stack & Syntropy Relay Network pricing, we have launched a new pricing page explaining all features of different tiers. Shortly, we’ll also be rolling out the option to pay for bandwidth using $NOIA, our native cryptocurrency.

4. Monitor your Network
Once you’ve set up your endpoint connections, you can begin monitoring latency, bandwidth, and packet loss between any two endpoints for any time interval.

You can click on a connection between any two endpoints to see the connection status, details about those two endpoints, a breakdown of the connection itself, and a link for further connection analytics. You’ll also have detailed visual representations of your network’s connection insights.
Here’s what the detailed connection analytics page will look like if you follow that link:

From there, you can change the two endpoints you’re analyzing or edit the time frame you’re looking at.
Wrapping up
Syntropy Stack has many tools for setting your network up with optimized bandwidth while monitoring and managing your endpoints and their crucial connections.
We’ve broken down the basic steps for getting started with the platform here, but if you’re interested in learning more or have specific questions, check out our Documentation.
Our team will support you on the Discord channel if you have any further questions.